
How Did The Polls Do in Iowa?
On Monday Evening, I wrote “It’s still tight, and polls have gotten primary/caucus results wrong before. But when Mitt Romney says ‘We’re going to win this thing’, I gotta say the numbers agree with him.”
Though Romney only won by 8 votes, the fact is the polls correctly predicted the winner of this difficult to poll contest. But how “right” were the polls?
American Research Group’s (ARG) Dick Bennett has already done a solid review of individual polls. As he notes, most polls did quite well, and the results of them fell within their expected 95% confidence intervals.
If I take one issue with Bennett’s analysis, it’s that he examines the four-day sample of the Des Moines Register’s Selzer & Co. poll instead of the final two-day sample.
As I have previously noted, the publication of a CNN poll during the Selzer & Co. time in the field changed the dynamic of the race by aiding a Rick Santorum surge.
It was for this reason that the Des Moines Register published two sets of results: one for the entire 12/27-30 period and one for the 12/29-30 period. I, believing it was the more accurate representation of the race, used only the 12/29-30 poll for my analysis.
The 12/29-30 Selzer & Co. poll found Mitt Romney leading with 24%, Rick Santorum in second with 21%, and Ron Paul in third with 18%. This poll was the only one to correctly forecast first, second, and third place. It was the most accurate in predicting the spread between Santorum and Paul, and second most accurate in estimating the spread between Romney and Santorum.
Overall, the 12/29-30 Selzer & Co. poll was the “most accurate” Iowa poll employing ARG’s Martin, Traugott, and Kennedy measure of pollster accuracy. This is not to say that Selzer & Co.’s full four-day (12/27-30) sample should not also be scored. The fact is that it was published as the “main” poll, but I think it’s necessary to point out that the two-day sample was quite accurate.
What about the polling aggregates?
Back on December 27th, I wrote “the polls are more likely to get a lot more right than wrong”, and that 2012 would compete with 2008 for being the most accurately polled Iowa Caucus. In 2008, “the average difference between the final polling average and candidates’ actual percentage was only 2.7%. The biggest difference in percentage [for any one candidate was] 5%.”
As you can see in this table, the aggregate polling average for the 2012 Iowa Caucus was among the most accurate ever.
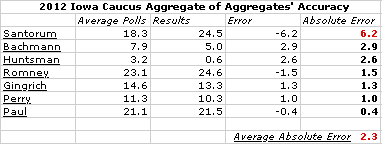
The largest error 6.2%, Rick Santorum’s, was slightly worse than 2008′s 5% error largest error. This largest error was half that of every year besides 2008. Furthermore, the average candidate error of 2.3% in 2012 was the smallest ever. Needless to say, the poll aggregates on average did very well.
What about the different averages themselves? As the table below illustrates, all had near identical average candidate errors*.
Though not statistically significant, 538′s largest error* (Rick Santorum as it was for all the aggregates) was the smallest at 5.2%. This makes sense as Santorum was surging, and 538′s model had a built-in momentum catcher.
But let’s bring it back one minute here.
Nate Silver came in with a very last minute altered projection in which Rick Santorum placed first, Ron Paul second, and Mitt Romney in third. If 538′s forecast had been this call, the order would have been incorrect, but the average error per candidate would have actually been only 2.2%. 538′s largest error would have been Mitt Romney’s 5.5%.
More interestingly, if our aggregate of the aggregates had included Silver’s late projection, it would have been slightly more accurate.
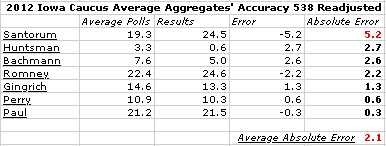
The average error per candidate would have only been 2.1%. The largest error for any one candidate would have been only 5.2% (for Rick Santorum). Thus, even if Silver second call was wrong, it still added some valuable information to our thinking that his original call did not.
But enough with Iowa, now it’s onto New Hampshire. While New Hampshire was the site of arguably the polling catastrophe of the 21st century, Iowa’s strong polling performance gives me confidence that history will not be repeated.
*Note, Selzer & Co.’s two-day sample had only a 1.5% average error and 2.6% largest error (Michele Bachmann), which beats all the aggregates.
Popular choices
- Migliori Siti Di Poker Online
- Casino Non Aams
- Casinos Not On Gamstop
- Casinos Not On Gamstop
- Casino Non Aams Italia
- Non Gamstop Casino UK
- Slots Not On Gamstop
- Non Gamstop Casinos UK
- UK Casinos Not On Gamstop
- Online Casino Real Money
- Casino En Ligne
- UK Casinos Not On Gamstop
- UK Casino Not On Gamstop
- Non Gamstop Casino UK
- UK Casinos Not On Gamstop
- Sites Not On Gamstop
- Casino Sites UK Not On Gamstop
- Beste Online Casino Nederland
- Slots Not On Gamstop
- Best Betting Sites
- Casinos Not On Gamstop
- UK Best Betting Sites
- Slots Not On Gamstop
- Meilleur Casino En Ligne
- Meilleur Casino En Ligne France
- Casino En Ligne
- Non Gamstop Casinos
- Lista Casino Online Non Aams
- Migliori App Casino Online
- Sites De Paris Sportifs En Belgique
- Meilleur Casino En Ligne Belgique
- Paris Sportif Tennis
- 出金が早いオンカジ
- Meilleur Casino Sans Kyc
- Casino En Ligne Nouveau
- Casino Bonus Sans Depot
- Casino Esteri Con Bonus Senza Deposito
- Casino En Ligne 2026
- Meilleur Casino En Ligne
- Nouveaux Casinos En Ligne 2026
- Poker Online
- Casino En Ligne Argent Réel
- Casino Online Non AAMS


[...] guru Harry J. Enten(I love the name of the blog: margin of error) looked at this past week’s Iowa entries and [...]
[...] guru Harry J. Enten(I love the name of the blog: margin of error) looked at this past week’s Iowa entries and [...]
[...] fact, exactly like Iowa, all the aggregates have the order of the finishers identical. Mitt Romney is first, Ron Paul is [...]
[...] to capture pretty well, and they have been two of the most accurately polled candidates in both Iowa and New [...]