Tied Up! Chances of an Electoral Draw
Wednesday, Harry referred to some of our forecasting work for the presidential race. With the race forecast to be so close nationally (our early approval model pegs the two-party vote right at 50-50), Harry discussed how it isn’t beyond the realm of possibility that Romney and Obama tie up the Electoral College with 269 electoral votes apiece.
What are the odds that happens? As it turns out, not great. The base of our forecasting model is a 10,000 simulation vote prediction for each state; from that, we can generate an electoral college prediction for each simulation. Out of those 10,000 simulations, only 143 - or 1.43 percent of cases — resulted in an Electoral College tie.
So the chances aren’t super high, even with a projected near-tie in the national vote. That makes sense considering that only specific combinations of states can actually give you a tie. But since 1.43 percent isn’t zero, we might have some fun looking at those scenarios.
We could go through all 143 — and if that’s your thing, here is a CSV file with all 143 simulations resulting in a tie — but I have tried to synthesize the information in a more useful way. (PS: If you have other ideas, I always invite suggestions in the comments.)
To figure out which states form the crux of the tie scenarios, I looked at how frequently each state went to Romney. Many states — 40 to be exact — favored Romney in more than 75 percent, or less than 25 percent, of the tied simulations. Some states, on the other hand, hover around the 50 percent mark, exhibiting clear fluidity in these tie scenarios.
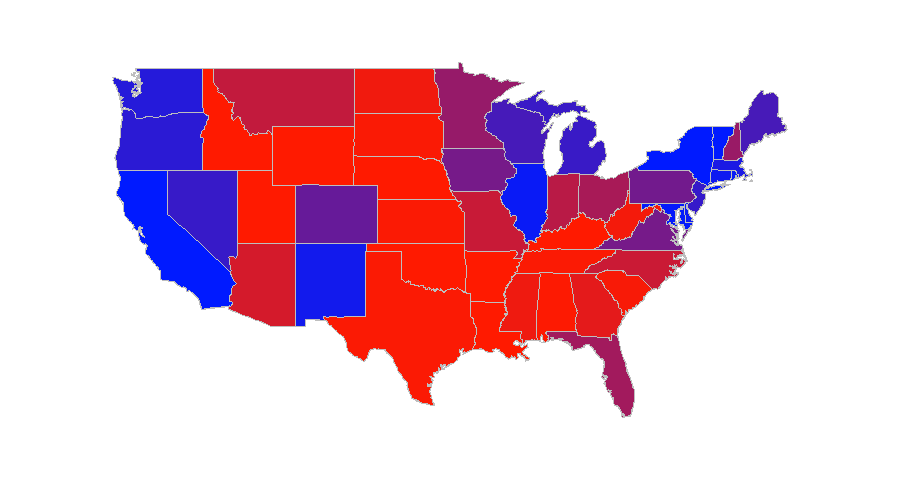
The map above shows the degree to which states swing in the tie scenarios. In pure red states, Romney wins 100 percent of tie simulations, and in pure blue states, Romney loses all of the tie simulations. Gradations approaching purple show the states most pivotal to a tie occuring.
As we can see, Iowa, Virginia, Minnesota, New Hampshire and Pennsylvania form the base of the crucial tie states. Colorado and Florida play pretty important roles, too. (And as one should expect, these match almost perfectly with the swing states predicted in the other 9,857 simulations.)
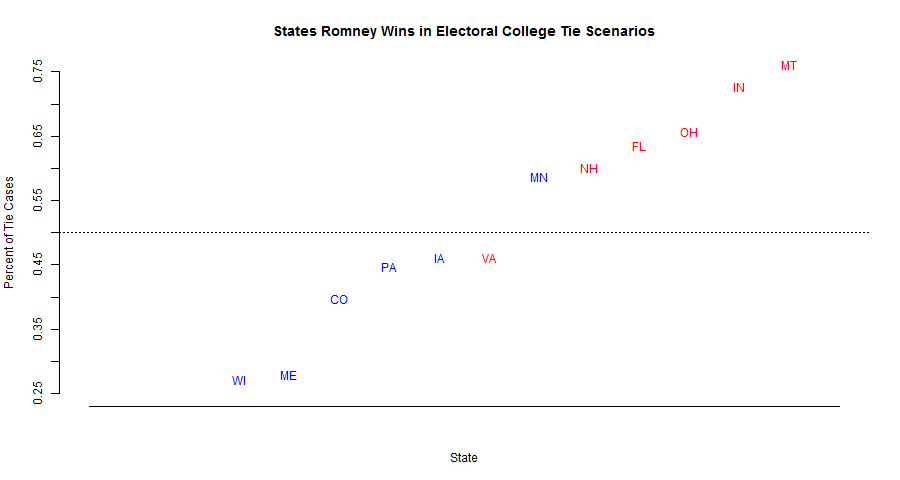
Below, I have zoomed in on states that went to Romney between 25 and 75 percent of the time. (The full figure is here.) We forecast the red states to go Republican and the blue states to favor President Obama.
Some of these states seem a bit surprising. Minnesota, for example, went nearly 55 percent for Obama, but forms a crux of the tie scenarios. In fact, our forecast generally predicts Minnesota to be highly competitive, and far too close to allocate to either candidate at this juncture. The other states, more commonly swing states, are forecast to move with the uniform swing and hover near the 50 percent mark.
Clearly 1.43 percent isn’t a large probability, but it ain’t zero. We only project Romney’s expected electoral votes to be a few more than President Obama’s (over the 10,000 simulations, Romney’s mean = 271.4 and median = 272). All indicators point to this being a nail-bitingly close race.
Say what you will about this being a super-intense and über-polarized race… I’ve got a five-months’ supply of popcorn and I’m ready for the show.
Popular choices
- Casino Non Aams
- Casinos Not On Gamstop
- Casinos Not On Gamstop
- Casino Non Aams Italia
- Non Gamstop Casino UK
- Slots Not On Gamstop
- Non Gamstop Casinos UK
- UK Casinos Not On Gamstop
- Online Casino Real Money
- UK Casinos Not On Gamstop
- UK Casino Not On Gamstop
- Non Gamstop Casino UK
- UK Casinos Not On Gamstop
- Sites Not On Gamstop
- Casino Sites UK Not On Gamstop
- Beste Online Casino Nederland
- Slots Not On Gamstop
- Best Betting Sites
- Casinos Not On Gamstop
- UK Best Betting Sites
- Slots Not On Gamstop
- Meilleur Casino En Ligne
- Non Gamstop Casinos
- Lista Casino Online Non Aams
- Migliori App Casino Online


No Comments