
Running against a weak frontrunner in Christine Quinn, Weiner had a golden opportunity to be New York mayor. Not any longer
Until now, Anthony Weiner’s political comeback from his original sexting scandal had been going very much to plan, probably exceeding even his own expectations. But with the new round of “Carlos Danger” revelations, that smooth progress is well and truly finished.
The Marist polling organization, which has tended to be the most favorable to Weiner, has him dropping 9pt, to 16%, and now behind first-placed Christine Quinn, on 25% among registered Democratic voters.
To be sure, these latest polls are not good news for Quinn, either. She trails in a possible runoff match-up with Bill Thompson, even as she was tied with Weiner.
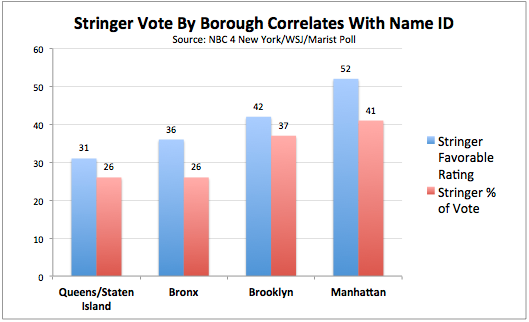
The real problem for Weiner, however, is that numbers under the hood are even more devastating. Weiner had seen his favorable rating jump from 34% in February, to 45% in April, to 52% in June. That number has now tanked, to 30%. His unfavorable rating, meanwhile, has jumped to 55% among registered Democrats. That, folks, is simply not going to work.
More than this, the bigger obstacle for Weiner actually has nothing to do with him. It involves the other anti-Quinn candidates. Remember, Quinn is disliked by a substantial portion of the Democratic primary electorate. The anti-Quinn vote is looking for someone, really anyone, who can beat her. That has been Anthony Weiner, thanks to his high name-recognition.
The latest polling, even pre-scandal, shows that other non-Quinn candidates have been moving up. Bill Thompson, with a strong African-American base, hit 20% in a Quinnipiac poll among likely voters just before the “Danger saga”. Marist just placed him at 14% among registered voters. Both of these are the highest numbers he has scored in these polls since Weiner got in the race.
Bill de Blasio doesn’t have the same ethnic base, but progressives love him. He has put up a 14% and 15%, respectively, in the last two polls – also his highest to date with these pollsters.
About the only good news Weiner can take out of the wreckage of his polling numbers is that more Democrats want him to stay in the race than wish him to drop out. This suggests Weiner just might be able to recover, again. The problem is that the 47% who want him to stay in is lower than the 53% that said he deserved a second chance last time around (just two months ago).
I should caution also that a one-night poll after such a jarring admission may not be the most accurate. Opinions about Weiner may not be fully-formed. His numbers may slide even further given even further negative press since the Marist poll was conducted. It’s also possible, though not likely, that they could bounce back. But we should remember that while only 40% of New York City Democrats wanted him to run just before he got into the race, over time his numbers went up and his favorable rating climbed steadily.
Moreover, one-night polling in a city that is notoriously difficult to survey isn’t likely to lead to the most accurate survey. In the comptroller race with Eliot Spitzer, which should be mostly unaffected by Weiner’s PR problems, Marist had very different numbers than Quinnipiac. Marist had Spitzer ahead by 12pt with likely voters, while Quinnipiac had Spitzer ahead by just 4pt.
All of these reservations aside, it’s clear Weiner’s in a heap of trouble. It will now be up to either Bill de Blasio or Bill Thompson to step in and fill the anti-Quinn void. Weiner had a golden opportunity to exploit Quinn’s electoral weakness; it looks as though he’s blown it.