
Against trend, Democrat Terry McAuliffe is set to win. After running a strong conservative, Republicans should take a hint
I’m hesitant to read too much into elections that don’t occur during the midterms or presidential election years. If off-year elections were all that predictive, Democrats would have done well in the 2002 midterms. Still, Republicans should pay attention to what’s looking increasingly like a Democratic win in the making in the 2013 Virginia gubernatorial election; that ought to make them at least a little worried for the 2014 midterms.
Historically, whichever party is in the White House loses the Virginia gubernatorial election, just as the White House’s party loses House seats in midterm elections. The last time this did not happen was 40 years ago, in 1973.
Moreover, Virginia’s voting patterns these days mirror the nation’s nearly perfectly. President Obama won nationally and in Virginia by 3.9pt. Democrat Tim Kaine won his 2012 senatorial race with 53% of the vote, while Democrats nationally took 54% of the senatorial vote. Both elections featured electorates in which whites now make up 70%, or a little more, during presidential years, and closer to 75% in non-presidential years.
That’s why we’d expect, all other things being equal, the Republican candidate, Ken Cuccinelli, to win Virginia’s gubernatorial election. And voters in Virginia did appear, at first, likely to follow the historical pattern. The first two polls which accounted for the higher white turnout in off-year and midterm elections had Cuccinelli leading Democrat Terry McAuliffe by 3pt and 10pt, respectively.
Then, something started to happen at the end of spring: voters got to know Ken Cuccinelli. Groups supporting McAuliffe and McAuliffe himself, aided by his background as a fundraiser for the Democratic National Committee and for Bill and Hillary Clinton, pounded the airwaves – pointing out Cuccinelli’s very conservative positions on contraception, gay rights, and now, the government shutdown.
The result is that McAuliffe has jumped ahead to a mid single-digit lead with a little less than a month to go before the election. Polling at this point has generally been reliably predictive of who will win.
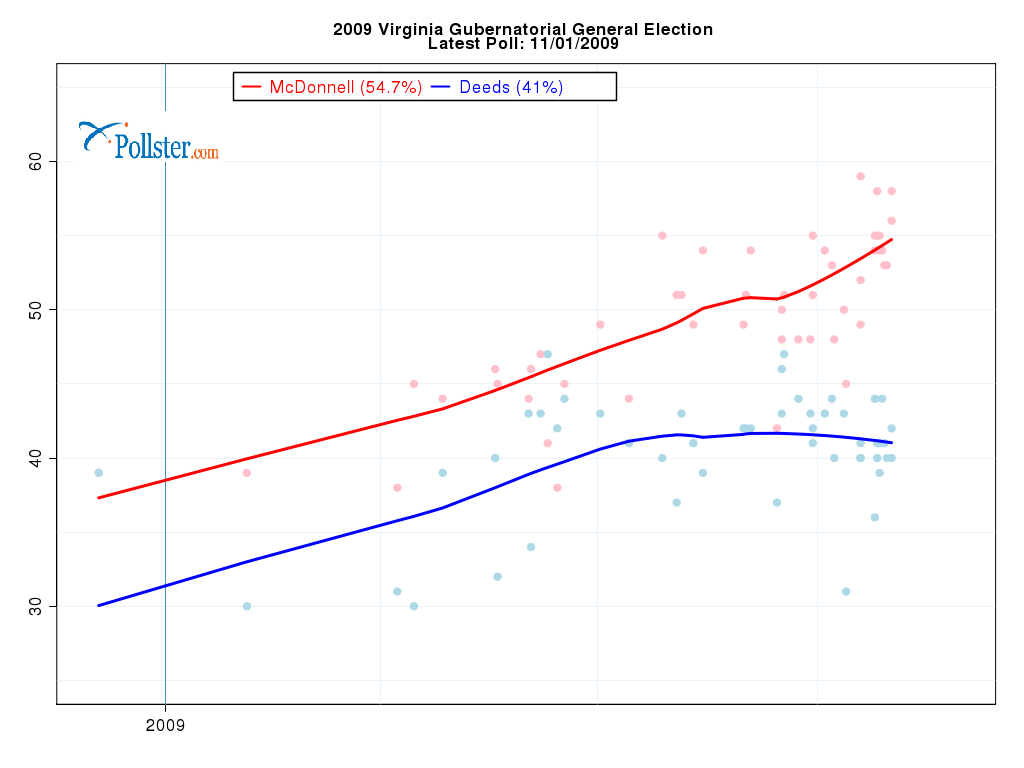
Now, it would be one thing if McAuliffe were winning because of some factor or factors unique to the state of Virginia, but I don’t think we can claim that. The incumbent Republican governor, Bob McDonnell, has faced criticism on grounds of ethics, yet his approval rating is relatively high. McDonnell also led McAuliffe in a pollsters’ hypothetical matchup, if he could have run again.
McAuliffe himself isn’t exactly Mr Popularity. His net favorable ratings are, at best, even, though most polls have his favorable rating below his net favorable rating. In other words, he’s not exactly the type of candidate you’d expect to break an election history pattern in a positive way for his party.
No, the real problem for Republicans in Virginia is Cuccinelli. While McAuliffe may rank slightly below a net positive favorable rating, Cuccinelli’s net favorable is 15-20pt in the red.
Voters simply think Cuccinelli is too rightwing: 43% of voters believe he is too conservative, which is up significantly from when he led in the polls in spring. That compares with only only 35% who believe McAuliffe is too liberal (and that’s more or less where it had been earlier in the campaign).
Therein lies the issue for Republicans nationwide, Cuccinelli embodies their present identity in many ways. Both are becoming deeply unpopular for conservative positions, and both are partying with Ted Cruz – even though they probably know that it doesn’t look good from the general electorate’s point of view.
Meanwhile, McAuliffe looks a lot like Democrats nationally. Both are not well-liked (you could even say, disliked), but they’re not seen as extremist – and, crucially, they look great when compared to the other guy.
None is this is to say a McAuliffe win means Democrats in the 2014 midterms are going to break the historical loss trend – as McAuliffe looks as though he’s going to do in Virginia. In fact, I don’t think Democrats will win seats in the House and will almost certainly lose some in the Senate. It would be a victory of sorts, though, if they can keep any losses to a minimum.
So, Republicans should have a bit of a sinking feeling when looking at Virginia. When presented with the choice between ugly and uglier, Virginians seem to have decided to go with ugly. This may not end up being predictive of next year’s midterms, but it should be unsettling, to say the least, to Republicans nationally.